
Author
Best Google Analytics Metrics to Track
Google Analytics is a powerful tool provided you can make actionable sense of the reports. I often hear people lament that Google Analytics is overwhelming and difficult. Website owners struggle with what metrics to evaluate and how to make sense of it all.
Yes, Google Analytics is a sophisticated and complex tool, but it doesn’t have to be difficult. If you know the best metrics to track, you can simplify your process and get actionable insights into site performance and potential improvements.
Let’s go over some of the metrics and reports you might find useful.
Goals and Conversions
The best, most valuable metric you can review are your defined goals. Just about every site online has at lease one goal. For a service business it could be to generate leads, if e-commerce it would be sales or for a non-profit maybe donations.
Regardless of the specific goal you’ll want to track when and how frequently these goals are met. Google Analytics makes this possible through setting up goal tracking. You can track every time someone purchases a product, fills out a contact form, submits a donation, etc…
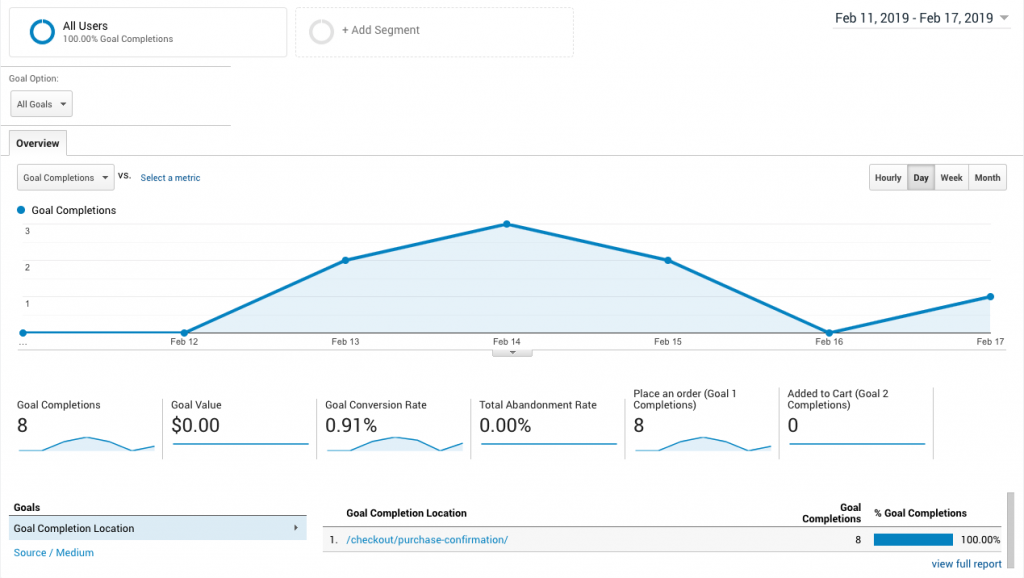
Not only can you see how many people completed a goal (often referred to as a conversion,) you can analyze what happened before and after the user completed said goal.
What traffic source generates the most goals? Search, paid media, website referrals?
What time of day do you get the most conversions?
What pages to users typically visit before converting?
All of this information is incredibly valuable when you’re looking to improve the performance of your website.
Steps that Lead to Conversions (Funnel)
Once goals are tracked you can see what steps users take leading up to the goal. For example what pages do they visit or what buttons do they click?
To elaborate further we often include several calls to action on a single page. A “contact us” button might appear in the header, again in the body of a page and finally in the footer. This is a design pattern called redundancy and increases the
It’s effective to include multiple paths to the important destinations. It’s also valuable to know which is used most often. How often do people click on the button in the header compared to the footer? Event tracking can allow
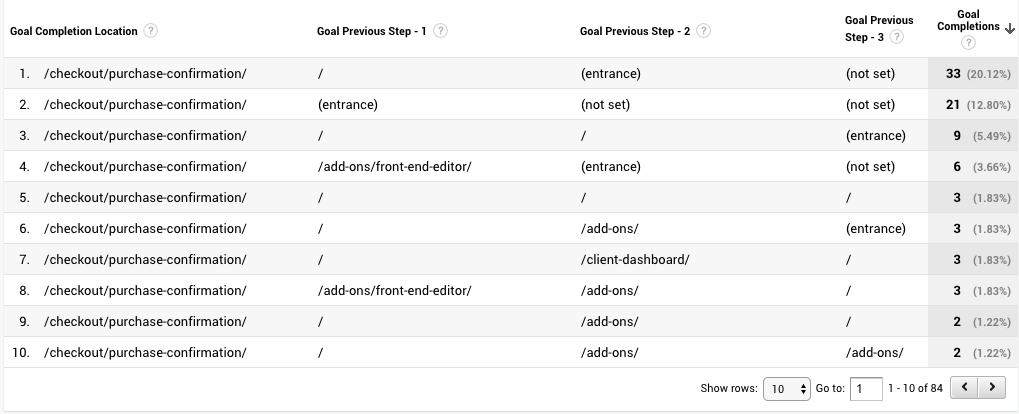
Requiring no additional setup, the “Reverse Goal Path” view displays what pages users typically view prior to completing a goal. This not only gives you insight into the
Engagement
Users that convert are the most tangible and valuable to track, but there is
- The average number of pages users visit in a session
- The average time spent on the site in a session
- The percentage of new vs returning users
- Top pages viewed
- Bounce rate (percentage of users who leave without visiting a second page)
On a high level you’re looking at how happy or engaged users are with your website. This is not always cut and dry. Sometimes low metrics are actually a positive.
Users finding exactly what they’re looking for with little effort is ideal, but this scenario could results in a low average number of pages per visit and short amount of time spent on the site.
Generally speaking when you are optimizing for engagement you’ll want to increase the amount of time users spend on the site and amount of content they consume.
As with all Google Analytics based analysis you’re looking for insights on what’s working and where you can make improvements. With engagement metrics you can identify pages where users don’t engage so you can improve them. You can also learn where users do engage, identifying what is working and could be applied elsewhere on the site.
Acquisition
It’s probably no surprise that you should know how people reach your website. Was it through a search engine? Paid advertising? A social media website? etc…
This is found through the “Acquisition” view.
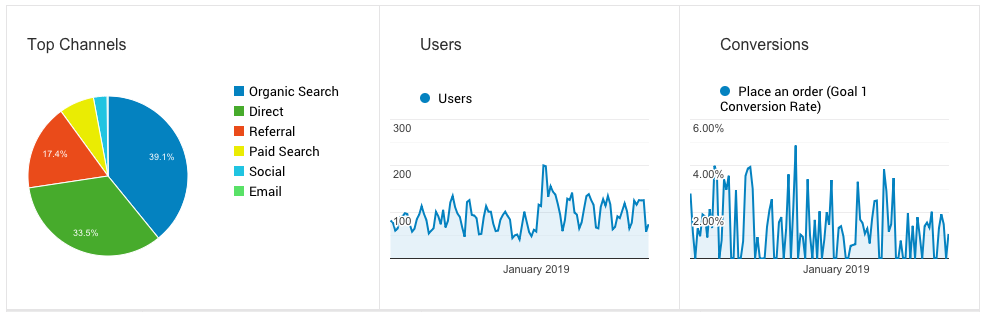
With acquisition you can track overall trends like is your traffic going up month to month, compare engagement of different traffic sources or which traffic source converts the most.
Landing Pages
Don’t assume all (or even most) users will arrive on your site at the homepage. You might find more users land on an internal page. Websites are often designed without this as a consideration.
From this perspective there is ample room for improvement to ensure the user understands what the site is about, who is behind it and where they are within the site.
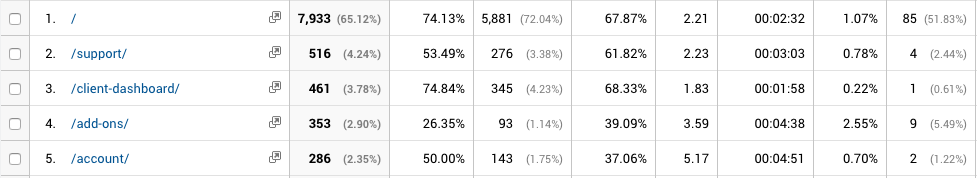
By navigating to Behavior > Site Content > Landing Pages you can see the top pages users land on. This becomes an effective list of pages that can be reviewed as a first page experience.
Similar to the other views you can evaluate how effective each landing page is at generating conversions. In the case above you can see that users who land on the “Add Ons” page convert at a high rate, which is a valuable insight.
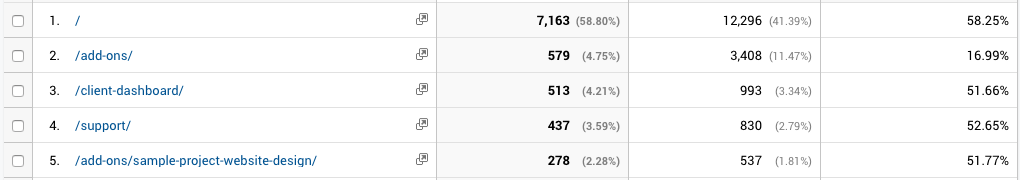
Exit Pages
Inversely it’s important to know which pages users leave your site from. Sometimes an exit is a positive thing — someone found what they are looking for and accomplished the goal that brought them there.
Other times it means there was a problem. The user didn’t find what they were looking for, got confused, or gave up. If you can identify pages people tend to leave from before completing a goal then you have a running list of pages that could be improved.
Is any critical content is missing?
Is this page confusing?
Is it not obvious what the next step will be?
As you make improvements to the page you can monitor the performance in Google Analytics to see if the exit rate goes down.
Summary
There are lots of other valuable metrics you can review in Google Analytics, we’ve only scratched the surface.
Over time you’ll find new ways to slice the data, combining or comparing elements discussed above.
What are the top exit pages from users who find the site via search?
What are the top landing pages for users who stay on the site for more than two minutes?
Remember the goal is to understand what’s performing and whats not. This allows you to amplify the top performing aspects of your site and improve what’s not performing.